Unlock Airbnb Market Data & Insights for Short-Term Rental with Accurate Airbnb Data.
Unlock the Potential of Any US Market with Customizable Short Term Rental Data

Mashvisor’s Airbnb Data
Make smarter investment decisions and maximize your returns in short-term rental markets across the U.S. with the help of Mashvisor’s extensive Airbnb data. Our powerful analytics offer real-time insights into occupancy rates, average daily rates, and rental performance, making it easy to spot high-yield opportunities. Whether you’re an investor or an Airbnb host, you can use our tools to simplify your market research and compare cities and neighborhoods quickly. Start making data-driven decisions today to boost your investment’s profitability and stay ahead of the competition. Discover the best markets and realize your property’s full rental potential now!

Key Features and Benefits
- In-depth Airbnb market data :
Take advantage of accurate and reliable short-term rental data sourced from active Airbnb listings across the US market. make smart decisions, and stay always a step ahead of market trends and opportunities.
- Real-time Airbnb analytics :
Access comprehensive Airbnb data analytics powered by advanced machine learning algorithms. Keep track of the latest market insights like average daily rates and occupancy trends and get the best investment opportunities.
- Tailored Search and Strategy :
Filter your search by budget and objective. Recognize price trends, seasons of high demand, and saturation level in the market to pinpoint the best property investment for maximum ROI.
- Neighborhood Level Investment Insights :
Dive deep into neighborhood analytics to help you make informed decisions. Compare side-by-side properties, monitor supply and demand, and find the best neighborhoods to achieve your investment goals.
- Dynamic Property Analysis :
Enhance your investment with unparalleled property-level data. Get insights about occupancy and daily rate estimates, profitability metrics, and ROI forecasts that ensure maximum returns from your selected property.

What Data Points Can You Get from Airbnb Rental Analytics?

Airbnb Market Competitiveness
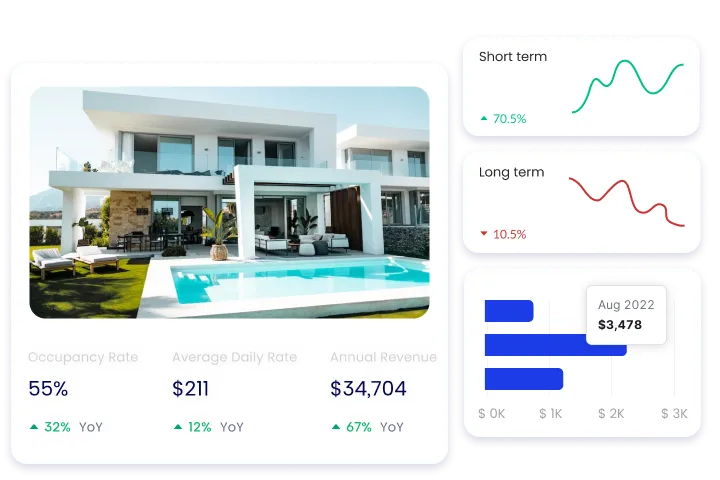
Discover your competitive edge within the US vacation rental market with reliable data from publicly available resources. Identify the best opportunities with access to our powerful Airbnb tool for a profitable hosting experience.

Short-Term Rental Performance Comparison
Elevate and benchmark your performance against similar Airbnb listings and short term rental properties. Stay ahead of the competition and unlock your full potential with this the #1 Airbnb analysis investment tool in the entire US market.

STP Property Type Breakdown
Understand guest preferences and booking patterns to find out the most appropriate Airbnb properties - whether townhouses or apartments - for optimal occupancy rate and gross revenue based on solid data from the local market.

Average Daily Rates (ADR)
Access real-time ADR data to improve the Airbnb pricing strategy of your vacation rental listings. Price your Airbnb listing strategically to boost gross revenue in a data-driven, informed decision-making process.

Occupancy Rates
Take your Airbnb business to the next level by understanding occupancy rate trends. Streamline pricing, boost bookings, and ensure your property stays in high demand throughout the year for a successful investing strategy.

Short Term Rental Revenue
Find out what comparable Airbnb listings earn on a monthly basis to benchmark your performance and boost the gross revenue of your own vacation rentals while minimizing costs and choosing the best financing method.

Vacation Rental Costs
Analyze the impact of startup costs and recurring operating expenses as well as the financing strategy on your bottom line with reliable short term rental data for data driven decisions in vacation rental investing.
Return on Investment
Choose investment properties for sale with optimal Airbnb cash on cash return and cap rate in all US cities for maximizing your profitability as a savvy real estate investor in short term rentals, no matter if you're a beginner or a pro.

Short-Term Rental Market Trends
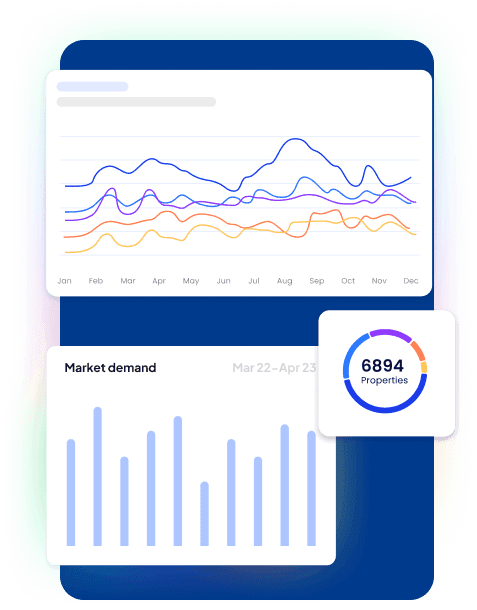
Stay ahead of other hosts with comprehensive Airbnb data and analytics. Understand market demand, analyze market supply, and be familiar with emerging opportunities to fine-tune your strategy and attract more guests.
How it works
Step 1: Identify the Most Appropriate Locations With the Market Finder
If you’re a beginner with no clue where to start, you need to find a place that’s good for the Airbnb strategy and matches your budget. The location will affect all metrics that eventually determine ROI.
The Mashvisor Market Finder can help you locate the best places for investing in short term rentals based on your own criteria, such as:
- Regulatory environment
- Property price
- Rental income
- Cap rate
- Occupancy rate
Setting up numbers for these factors will list the top 10 areas in the United States market that match your expectations. Doing this will put a solid foundation on your real estate investing journey.
Step 2: Perform Local Market Evaluation With the Neighborhood Analysis Tool
Once you find a potentially good city and neighborhood through the Market Finder, Mashvisor allows you to perform a thorough neighborhood Airbnb data analysis. It will give you a better insight into the market you’re considering.
Some things to look at when performing a neighborhood evaluation are:
- Afford home values that will fit your financial resources and boost your ROI.
- High Airbnb occupancy rate as a result of easy access to tourist attractions and public amenities that draw in renters and guests.
- High Walk Score and public transportation availability.
- Substantial rental income to provide positive cash flow amid increasing property prices.
- Good short term rental cash on cash return to ensure that you’ll be making money from your vacation rental business.
The general rule of thumb to remember is that you should combine qualitative and quantitative considerations. The neighborhood you’re considering should make you feel safe and welcome when you walk around. But it should also offer solid Airbnb data analytics to be worth it as an investment destination.
Step 3: Spot the Most Ideal Airbnb Investment Opportunities With the Property Finder
The next stop along your journey of using the Mashvisor Airbnb data analytics platform should be the Property Finder. When you know where you want to invest, it’s time to look for profitable rental properties for sale there. The best thing about the Mashvisor Property Finder is that you can focus your search on Airbnb for sale, not just any residential property listed on the market.
You can enter the following criteria:
- City
- Budget
- Property type
- Property size
This will provide you with a list of available MLS listings that are ideal to operate as short term rentals. The list will start with the most profitable opportunities on top so that you can focus your efforts on them instead of wasting time on suboptimal properties.
With the Property Finder, you can even perform investment property searches in up to five markets simultaneously. This is particularly useful for Airbnb hosts who have yet to decide and are considering a few options.
Step 4: Assess a Property’s Profitability With the Airbnb Calculator
Perhaps, the most important aspect of Airbnb data analysis is the actual computation of numbers to determine whether a property is worth it. It is where Mashvisor’s Airbnb Calculator comes in handy.
The tool allows investors to calculate critical Airbnb metrics, such as occupancy rate, revenue, expenses, cash flow, and return on investment. You can use some of the features of the Airbnb Calculator free of charge, while a small subscription fee is needed for access to detailed rental property analysis.
This best Airbnb analytics tool is highly interactive, as it gives investors the option to change numbers and enter new variables. In this way, they can customize the Airbnb analysis to fit their specific situation. For instance, you can change the rental income if you think you can charge a higher daily rate or add new expenses. All other numbers will be automatically recalculated.
All in all, the Mashvisor Airbnb Calculator gives you access to many more features than the AirDNA Rentalizer, its closest competitor.
Step 5: Use the Platform to Access Current Airbnb Rental Comps
The Mashvisor platform also provides easy access to updated vacation rental comps in any given market and neighborhood. These comps are active Airbnb listings. For each property listed on Mashvisor, you can see comparable rentals in the area and check out what results they can produce. This will help you incredibly in focusing your rental property analysis.
Moreover, it’s important to note that all Airbnb data offered by the Mashvisor tools use rental comps as the basis for analysis. This is the most productive way to estimate the performance of an investment property in the Airbnb industry.
Step 6: Establish Your Airbnb Daily Rates
Successful Airbnb investments don’t end with purchasing a property. Indeed, becoming an Airbnb host involves a lot of active work, the core of which is setting up the right Airbnb pricing strategy. Your Airbnb pricing needs to be dynamic to continuously reflect changes in the local short term rental market. Indeed, every day your property is listed for renting needs its own rate.
Needless to say, doing this manually entails a ton of hard work as you have to gather Airbnb data, analyze it, and calculate an appropriate rate based on your analysis. Lucky for investors, the Mashvisor Dynamic Pricing tool is the best Airbnb analytics tool for optimizing this aspect of running a vacation rental business.
You can connect your Airbnb listing to your Mashvisor account to automate the daily pricing. The tool will evaluate your property’s performance and the performance of other rentals in the area to come up with the best rates for each night. The best part is that you can allow the tool to adjust the rates directly on the Airbnb platform so that you don’t have to intervene at all.
You should know that the Mashvisor Dynamic Pricing tool is programmed to optimize for rental income and return on investment, not occupancy only. This sets it apart from other popular alternatives like Airbnb Smart Pricing and AirDNA Smart Rates.


