

What Is a Heatmap?
We are sure that you’ve come across a heatmap before. Essentially, a heatmap shows data in a visual form rather than a numerical form, using different colors to represent different ranges or percentages. A heatmap can be used as a visual illustration in a wide variety of situations: from depicting presidential election results to showing the most popular restaurants in town. Thus, it should come as no surprise that using a heatmap has application in real estate investing too, where a heatmap is used to find the best places to invest in real estate. In addition to finding income properties, using a heatmap is also helpful in identifying the optimal rental strategy in a specific location.
Why Should Real Estate Investors Use a Heatmap?
When real estate investors try to decide whether to buy an investment property, they naturally look for areas with the best real estate markets and the highest return on investment in properties. Usually this requires many days and even weeks to conduct real estate market analysis and for researching investment properties, to be able to locate the best places for real estate investments. Using a heatmap, however, allows real estate investors to find the best areas to invest in income properties within a few minutes. For example, Mashvisor’s heatmap zooms in on a city and shows real estate investors the neighborhoods divided by such real estate metrics as listing price, cash on cash return, rental income, and occupancy rate. Since all this data is divided by rental strategy – traditional rentals and Airbnb rentals – Mashvisor’s heatmap directly helps a real estate investor pick the optimal rental strategy in each of the neighborhoods within a city. Thus, using a heatmap has turned into the best way for finding income properties and choosing the right rental strategy for them.
To start using Mashvisor’s heatmap immediately for making the best real estate investments, sign up here.
Now it’s time to look at the different real estate metrics a heatmap shows, what they mean, and how they help in finding income properties and choosing a rental strategy.
What Information Do Real Estate Investors Get from Using a Heatmap?
Listing Price
Regardless of how rich of a real estate investor you are, the first questions you always ask before finding income properties are: “How much money do I have? What is my budget? How much will an investment property cost me?” Whether investing close to home or out of state, a real estate investor always needs to stick to his/her budget in order to make money. That’s why using a heatmap for finding income properties is the best way to go! Mashvisor’s heatmap shows you the neighborhoods in a city which have the lowest listing price, medium listing price, and the highest listing price. Remember that the red means low, while the green means high. Just stick to the red color for finding income properties at affordable prices. Or go for the green color for finding income properties to rent out as luxury homes.
While the listing price of an investment property is not directly related to choosing the optimal rental strategy, it will play an important role in calculating the return on investment (cash on cash return and cap rate) for traditional rentals and Airbnb rentals.
Traditional Cash on Cash Return and Airbnb Cash on Cash Return
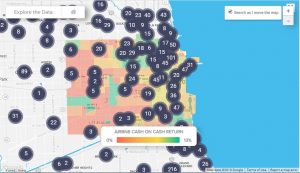
Mashvisor’s heatmap will tell you how the cash on cash return changes as you move from one neighborhood to another in your city of choice. What is great about using Mashvisor’s heatmap is that it shows you both the traditional cash on cash return and the Airbnb cash on cash return. And this is exactly how it not only helps real estate investors in finding income properties but also in choosing the optimal rental strategy in each neighborhood.
Traditional Rental Income and Airbnb Rental Income
Rental income is the core of real estate investing, at least when it comes to investing in rental properties. Rental income is the monthly salary of the real estate investor. Using a heatmap when finding income properties makes the life of a real estate investor much easier because it eliminates the need to do research to find rental comps just to find the average rental prices in an area. With Mashvisor’s heatmap, an investor can find the areas with the highest rent immediately.
Of course, the data is separated by rental strategy, so Mashvisor’s heatmap will show you both the neighborhoods with the highest traditional rental income and the highest Airbnb rental income within a city.
Airbnb Occupancy Rate
If you as a real estate investor are leaning towards Airbnb rentals or are at least interested in trying out this rental strategy, you will be happy to know that Mashvisor’s heatmap also shows Airbnb occupancy rate when finding income properties. Since rental income from Airbnb is received per stay and not per month, the Airbnb occupancy rate would determine your Airbnb rental income straightforward.
As most real estate investors know, finding income properties in the optimal locations can be challenging. Choosing the best rental strategy to assure maximum return on investment is even more challenging. This requires market research, real estate market analysis, researching investment properties, tiresome data collection, data entry into spreadsheets, cumbersome calculations, etc. Mashvisor’s heatmap eliminates the messy process of analyzing real estate investments. It allows real estate investors to focus on a particular neighborhood in a city which has the highest return on investment and to choose the optimal rental strategy there.
To start using Mashvisor’s heatmap immediately for making the best real estate investments, sign up here.
Note: The images of Mashvisor’s heatmap used in this blog illustrate Chicago.