The Airbnb occupancy rate is one of the crucial factors for the success of a vacation rental as it directly affects revenue and ROI.
Key Takeaways
- The Airbnb occupancy rate is calculated by dividing booked nights by available nights and is one of the crucial factors for the success of a vacation rental business.
- A good occupancy is usually above 55%, but a high occupancy rate is not always the best option. What matters most is achieving the best balance between occupancy and nightly pricing.
- The occupancy rate varies significantly according to location, seasonality, property type, and management strategy.
- There are a number of things hosts and property managers can do to decrease vacancy without lowering daily rates too much.
While there are a number of factors that impact the occupancy of a rental property, a key determinant is location. Thus, in this article, we’ll take a look at the average Airbnb occupancy rates by city in a few major global markets, including the US, Canada, the UK, and Australia. We’ll zoom in on the cities with the highest and the lowest occupancies as well as the seasonality behind them.
This should help a real estate investor identify some top locations for Airbnb investments that are guaranteed to bring in a lot of traffic as long as you manage your property correctly. Moreover, it will help Airbnb hosts and managers check whether their properties perform as expected based on comparison with market-wide averages.
To conclude, we’ll offer actionable tips on how to boost the occupancy rate of Airbnb houses as well as the best amenities for low vacancies.
What Is Airbnb Occupancy Rate?
In brief, the occupancy rate measures the proportion of time for which an Airbnb listing is booked compared to the total available nights. When multiplied by the daily rates, it provides the monthly or annual rental income of a property.
In this regard, there are two slightly different metrics that hosts and property managers should use when analyzing the bookings and reservations of their properties:
First is the occupancy rate, which measures the number of nights booked over the total number of days in the said period. It is calculated as a percentage and is usually computed on a monthly or annual basis.
For example, if guests stayed at your rental for a total of 20 days in April, the occupancy rate is 20/30 x 100% = 67%.
Meanwhile, adjusted occupancy rate is the percentage of nights booked over the total nights for which you made it available for booking. This last part makes the adjusted occupancy rate slightly different from the standard one.
For instance, if in April your property got booked for 20 days, while you listed it for 25 days, the adjusted rate is 20/25 x 100% = 80%.
As you can see, this is higher than the standard occupancy rate.
Yet another measure that investors took to consider is the vacancy rate. It is the exact opposite of the Airbnb occupancy rate and measures the share of days for which your property is not booked (vacant) over the available nights in the investigated period.
In the same month of April, the vacancy rate is 10/30 x 100% = 33%.
How to Calculate the Airbnb Occupancy Rate
Calculating the Airbnb occupancy rate is relatively easy. The occupancy rate of a vacation rental property is calculated by dividing the number of booked nights in a month or a year by the total number of nights over the same period of time.
Airbnb Occupancy Rate Formula
The Airbnb occupancy rate calculation is done using the following formula:
Airbnb Occupancy Rate = Booked Days/Available Days x 100%
Calculating Step by Step
To calculate the occupancy of a short-term rental, you need to go through these steps:
- Establish the number of nights for which your property was reserved over the investigated period. You can find this in your booking calendar.
- Determine the total number of nights for which your vacation rental was available for booking over the same period. Once again, this should be easy to obtain from your calendar.
- Divide the first number by the second number and multiply by 100 to get the occupancy rate over the studied period in percentage form.
To fully understand how this vacation rental data point works, let’s go through an example:
You own a short-term rental in Miami, FL. In March 2024, you made your property available for renting for 26 nights, while you blocked it for the remaining 5 nights for maintenance works. You welcomed guests for 12 nights.
Airbnb Occupancy Rate = 12/26 x 100% = 46%
As you can see, calculating the occupancy rate for a single property for one or two months is easy. However, things can get pretty complicated if you want to know the occupancy rate of an entire area to know where to buy a profitable investment property, or to compare the performance of your rental to the average.
That’s where the Mashvisor Airbnb data can help you. We cover the entire US market as well as all leading global markets and provide all crucial vacation rental data points and insights that owners and managers need to boost their business. These include—but are not limited to—Airbnb income, recurring expenses, cash flow, Airbnb cap rate, and Airbnb cash-on-cash return.
Sign up now to see what Airbnb occupancy rate your property is expected to bring.
What Is a Good Airbnb Occupancy Rate?
A good occupancy rate is, in general, 55% or more. The reason for this is simple:
According to Mashvisor’s proprietary data, the average occupancy rate in the US market in the spring of 2025 is around 50%, down from 57% last year. This is due to an influx of new short-term rental listings that have outpaced demand growth, inflation-induced belt-tightening among US travelers, and a lull in international arrivals amid ongoing political uncertainties.
As a savvy Airbnb host or property manager, you want to perform at least a few percentage points better than the average owner.
However, you should keep in mind that occupancies vary widely from one market to another, from one season to another, and from one property type to another. Thus, when trying to figure out whether your investment is striking a good Airbnb occupancy rate, you need to conduct a detailed analysis that considers all these factors.
Additionally, a high occupancy rate does not always translate into a good metric. At the market level, there are cities that might benefit from strong demand, while the average nightly rate is relatively low, which leads to suboptimal Airbnb rental income.
At the property level, if you maximize occupancy, you might be lowering nightly prices too much and sacrificing revenue.
So, the best occupancy for real estate investors is the one that results in the highest income and profitability.
Airbnb Occupancy Rates by City in the United States (2025 vs 2024)
First, let’s begin with the average Airbnb occupancy rate by city in the US market, the largest Airbnb market worldwide.
The table below shows the average vacation rental occupancy rate in 2024 and 2025 for the 25 US cities with the largest number of active listings on the platform, in April 2025.
Note that all Airbnb stats per city quoted in the rest of this article come from Mashvisor Airbnb data. As a leading global provider of short-term rental data, Mashvisor gathers performance data from reliable publicly available sources to provide ready market research and analysis for vacation rental hosts and managers.
So, without further ado, what is the average Airbnb occupancy rate per city in the US?
| City & State | Number of Airbnb Listings | Airbnb Occupancy Rate (2025) | Airbnb Occupancy Rate (2024) |
| Nashville, TN | 5,976 | 50% | 56% |
| Miami, FL | 5,425 | 62% | 62% |
| San Diego, CA | 5,398 | 57% | 73% |
| Fort Lauderdale, FL | 4,766 | 58% | 62% |
| Houston, TX | 4,461 | 50% | 55% |
| Atlanta, GA | 3,979 | 49% | 52% |
| Miami Beach, FL | 3,819 | 60% | 60% |
| Austin, TX | 3,816 | 54% | 60% |
| San Antonio, TX | 3,589 | 56% | 58% |
| Davenport, FL | 3,437 | 58% | 57% |
| Chicago, IL | 3,374 | 52% | 63% |
| Myrtle Beach, SC | 3,277 | 39% | 45% |
| Honolulu, HI | 3,233 | 65% | 75% |
| Coconut Grove, FL | 3,127 | 64% | 63% |
| Lauderdale By The Sea, FL | 2,936 | 62% | 60% |
| Seattle, WA | 2,831 | 55% | 66% |
| Washington, DC | 2,766 | 63% | 71% |
| Ocean City, MD | 2,620 | 34% | 36% |
| Los Angeles, CA | 2,605 | 62% | 72% |
| Hilton Head Island, SC | 2,505 | 44% | 54% |
| Golden Oak, FL | 2,443 | 64% | 65% |
| Tucson, AZ | 2,411 | 55% | 60% |
| Tampa, FL | 2,371 | 50% | 61% |
| Charlotte, NC | 2,345 | 59% | 57% |
| Philadelphia, PA | 2,309 | 49% | 61% |
A few important observations emerge from the Airbnb occupancy data presented above.
First and foremost, the US markets with the most Airbnb listings have a wide range of average Airbnb rates: from 34% in Ocean City, MD, to 65% in Honolulu, HI.
Many of these numbers are above the US national average despite the large number of listings, signifying that these markets are so popular that properties don’t compete with each other.
Second, eight of the 25 cities with the most listings are located in Florida, and overall, they boast good Airbnb occupancy rates. Florida remains a leader in the US vacation rental market despite the lower demand growth this year.
Third, all the markets experienced a decline in their vacation rental occupancies between 2024 and 2025. This means that the Airbnb market in the US is becoming saturated. If you’re planning to start your first Airbnb business, make sure to conduct a thorough market analysis to find the best place to buy a short-term rental. And if you’re currently managing one or several Airbnbs, you can find our tips on how to increase (or at least maintain) your Airbnb occupancy rate.
Average Airbnb Occupancy Rate in 10 Selected Cities in North America (2024-2025)
Next, we’ll analyze last 12-month trends in the average Airbnb occupancy for performance evaluation of some of the best short term rental markets in the US defined as the cities with the highest number of active Airbnb listings in April 2025. We’ll also discuss what changes in the average occupancy rate for Airbnb owners and managers can expect.
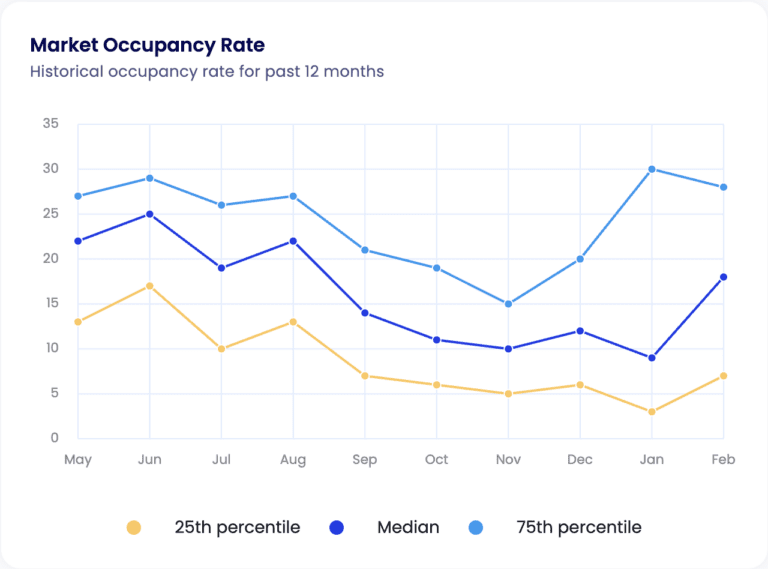
1. Nashville, TN

12-month historical Airbnb occupancy rate performance in Nashville, TN
In the past year, Nashville’s Airbnb occupancy eased due to market oversupply, tighter travel budgets, and pronounced seasonality. Investors who chased normalized post-pandemic demand saw both peak highs in the spring and early summer and deep lows in the winter.
If you already have an Airbnb in this city or plan to start one, be prepared for the same cyclical pattern, but with even lower demand. Your success hinges on targeting shoulder seasons, optimizing your pricing, enhancing your amenities, and capitalizing on events.
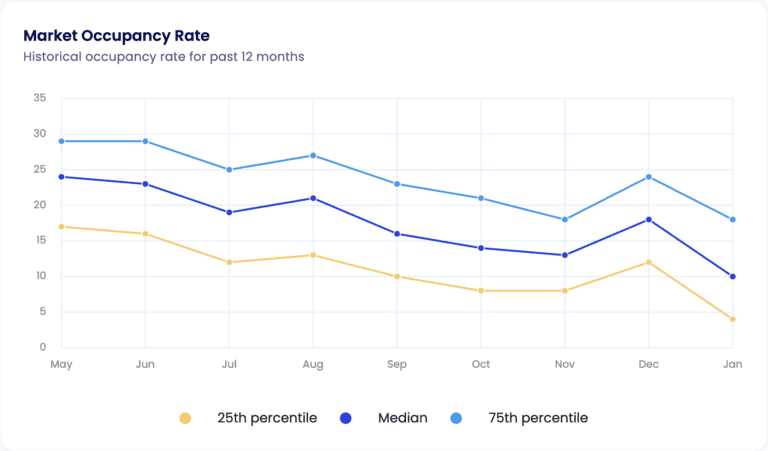
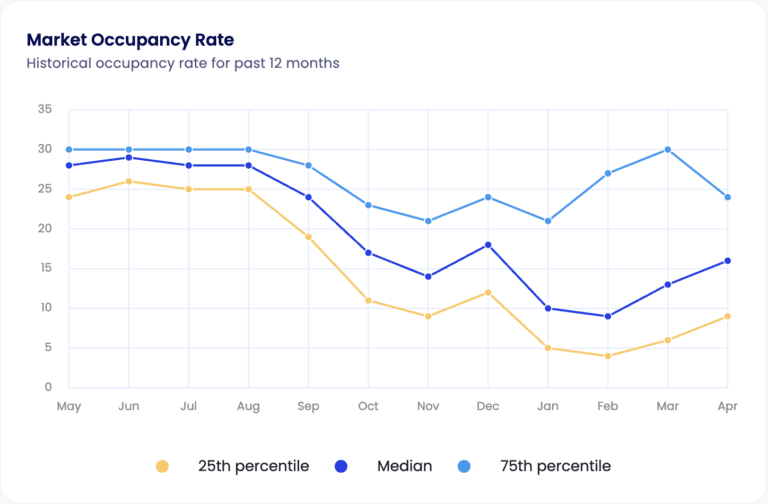
2. Miami, FL
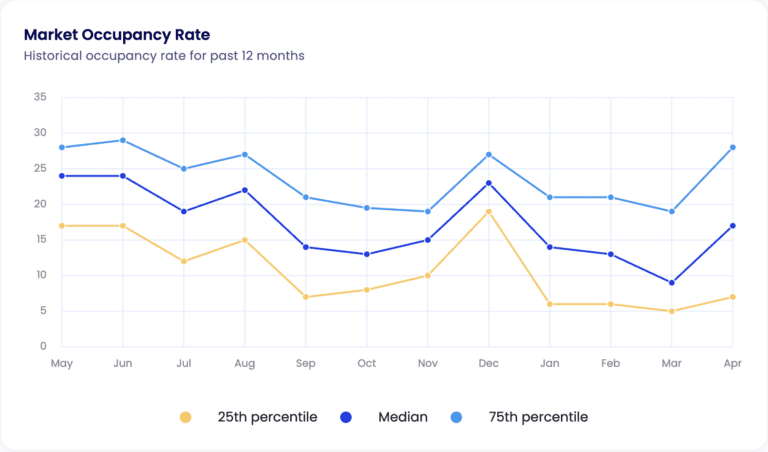
12-month historical Airbnb occupancy rate performance in Miami, FL
Airbnb statistics by city, provided by Mashvisor, show that Miami’s Airbnb occupancy went down across all tiers due to post-pandemic normalization of travel, an increase in the number of available listings, and economic headwinds.
While high-performing listings dropped from 29% in June to 19% by March, median-performing listings fell into the single digits. Seasonal swings remain pronounced, with demand high during winter (December to February) and mid-spring to late summer (April to August).
Over the next year, expect strong winter rebounds punctuated by shoulder-season spikes around Art Basel in December and spring break. Summer will be busy, so use dynamic pricing, take advantage of event-driven promotions, and make your property stand out to stay booked on Airbnb.
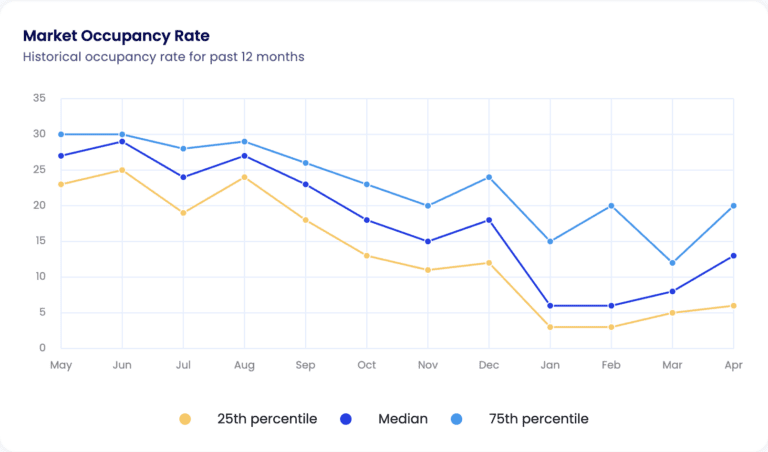
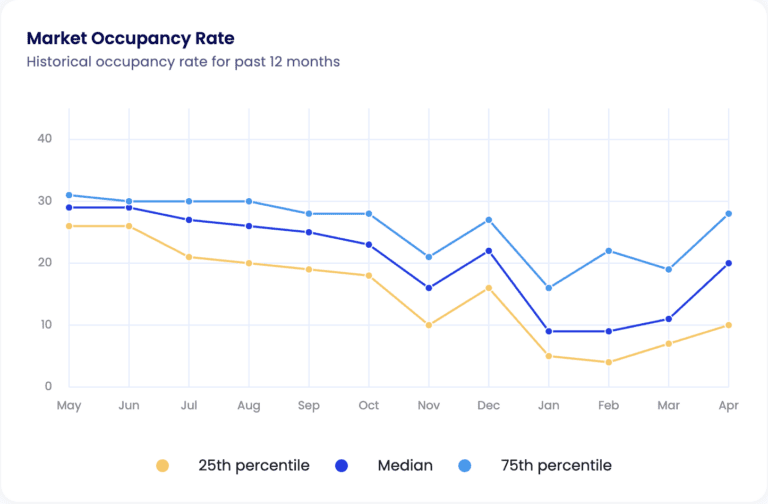
3. San Diego, CA
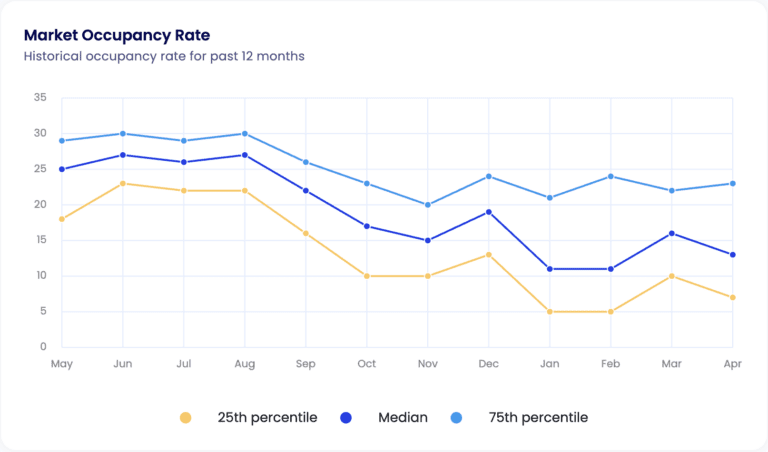
12-month historical Airbnb occupancy rate performance in San Diego, CA
San Diego’s Airbnb market cooled over the past year as new listings flooded faster than demand, driving down occupancy in the summer and into late fall. Meanwhile, median-performing rentals dipped to 5% to 11% by January and February.
Seasonality in San Diego remained pronounced: summer peaks around Comic-Con (July) still sparked strong demand, but autumn and deep winter (except for December) saw steeper troughs.
Looking ahead, hosts can expect 28% to 30% occupancy for top listings in June to August and should target the shoulder seasons (spring and early fall) with tailored promotions. Winter will stay soft, so lean on last-minute deals and long-stay discounts, and use dynamic pricing and unique amenities to stand out.
4. Houston, TX
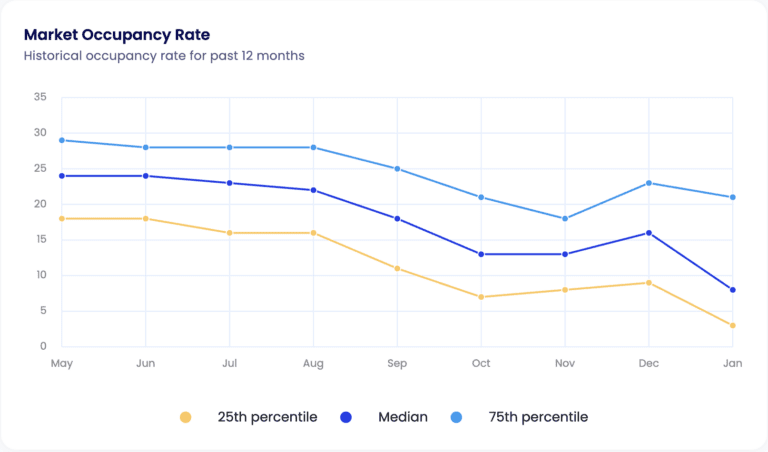
9-month historical Airbnb occupancy rate performance in Houston, TX
Between May 2024 and January 2025, Houston’s Airbnb occupancy declined due to risks from hurricane season, post-summer leisure lulls, and rising competition from new listings and hotels. Economic headwinds and slowdowns in the energy sector further cooled bookings, although there was a modest holiday spike in December, followed by a decline the following month.
Looking ahead, hosts can anticipate a strong spring revival fueled by events and conventions. However, ongoing supply growth suggests that occupancy will cap below pre-pandemic peaks.
To stay competitive, implement dynamic pricing, flexible policies, and minimum-stay rules. Consider investing in property upgrades. Lastly, target niche events in town to ride seasonal dips and maximize revenue.
5. Atlanta, GA
9-month historical Airbnb occupancy rate performance in Atlanta, GA
Between May 2024 and January 2025, Atlanta’s Airbnb occupancy dipped amid mid-summer heat, convention calendar gaps, and rising listing supply. Economic pressures and higher travel costs also squeezed leisure and business bookings, although there was a modest holiday bump in December, followed by a trough in January.
From May 2025, hosts can leverage spring events, summer student relocations, and fall peaks around Dragon Con in September and college football weekends.
To boost occupancy, use dynamic pricing and minimum-stay rules, invest in workspace and contactless check-in, and target niche segments such as conference attendees and university tenants to ride the seasonal swings.
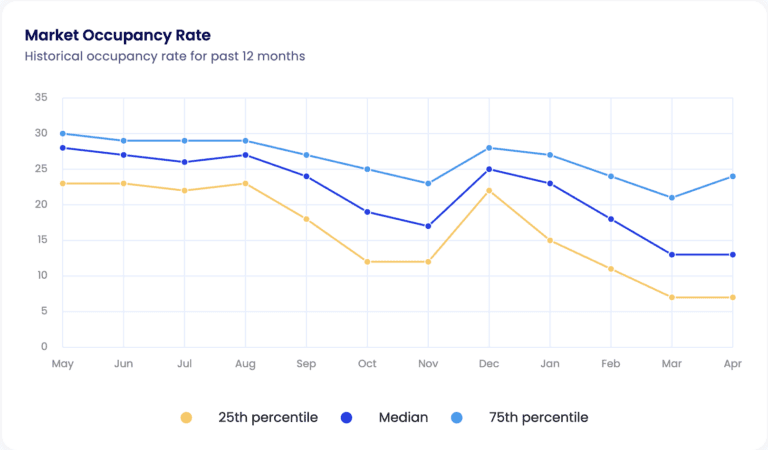
6. Chicago, IL
12-month historical Airbnb occupancy rate performance in Chicago, IL
Chicago’s Airbnb occupancy declined notably from summer peaks to winter lows over the past year, driven by pronounced seasonality, surging competition from new listings, and strict local regulations.
Hosts looking ahead should capitalize on major events (like Lollapalooza), offer off-season deals, target longer stays, and upgrade their amenities to boost occupancy and nightly revenue.
For investors, Chicago remains a viable but challenging market, offering modest returns (around a 3% Airbnb cap rate), high seasonal risk, tough regulations, and market saturation. If you want to succeed, you’ll need to be proactive instead of passive: optimize your pricing regularly, target niche segments, and comply with local regulations.
7. Myrtle Beach, SC
10-month historical Airbnb occupancy rate performance in Myrtle Beach, SC
Myrtle Beach’s Airbnb occupancy soared in the summer of 2024, then plunged through winter, highlighting extreme seasonality in this market. Competition rose as new listings flooded the market, while traveler patterns favored warm-weather beachgoers.
Over the next year, expect repeat summertime peaks and off-season lows.
To thrive, use dynamic pricing, optimize your listing’s visibility, and target niche guests with promotions (for example, snowbirds looking for winter retreats). You can boost your average daily revenue (ADR) by adding high-demand amenities (like a pool or hot tub), adjusting minimum stays, and pricing around local events.
8. Honolulu, HI
12-month historical Airbnb occupancy rate performance in Honolulu, HI
Honolulu’s Airbnb occupancy has fallen notably over the last 12 months due to seasonal fluctuations, increased local competition, economic factors, and strict new regulations, such as Bill 41, which limits short-term rentals mostly to resort zones.
Looking forward, expect continued strong summer and holiday demand but lower off-season occupancy. Make sure to adopt dynamic pricing, target niche markets like remote workers and snowbirds, enhance your amenities, and use event-driven pricing to maximize your revenue. And if you’re thinking of setting up an Airbnb in Honolulu, prepare to navigate high regulatory barriers, market saturation, and high property values.
9. Seattle, WA
12-month historical Airbnb occupancy rate performance in Seattle, WA
Seattle’s Airbnb occupancy in the last 12 months reflected strong seasonal patterns: high summer peaks driven by tourism, cruises, and major events, followed by notable winter declines due to weather and economic caution.
For the next 12 months, expect similar seasonality, with peak demand in the summer and holidays and persistent low demand in winter.
You can maximize your Airbnb’s occupancy and revenue by implementing dynamic seasonal pricing, improving your amenities to justify higher daily rates, targeting niche guest segments (such as families in summer or remote workers off-season), and carefully managing minimum stays.
If you’re an investor thinking of setting up an Airbnb in Seattle, consider investing in a mid-term rental (more than 30 days’ rent) instead. Due to Seattle’s changing regulatory conditions, this strategy can be a more profitable alternative, especially during low-demand periods.
10. Washington, DC
12-month historical Airbnb occupancy rate performance in Washington, DC
Washington, DC’s Airbnb market over the last 12 months has featured strong seasonal fluctuations, driven by events such as the Cherry Blossom Festival, summer tourism, and winter slowdowns.
Looking ahead, expect similar trends over the next year, with peak occupancy in spring and fall, moderate summers, and lower demand in winter.
To maximize revenue, adopt dynamic pricing, target both business and leisure travelers, invest in your amenities, and comply with DC’s strict regulations for short-term rentals.
Meanwhile, those who wish to invest in the DC area should offer both short-term and mid-term rentals to ensure compliance with licensing and to adapt to market shifts.
Airbnb Occupancy Rates by City in Canada 2025
In addition to the US, Canada is another important market for short-term rental hosts and managers.
If you’re wondering what is the average occupancy rate for Airbnb in major cities in Canada, you can see below:
- Ottawa: 69% (-56% YOY)
- Vancouver: 56% (-62% YOY)
- New Brunswick: 53% (-13% YOY)
- Hamilton: 51% (-59% YOY)
- Greater Sudbury: 39% (+0% YOY)
Canada’s Airbnb market has seen significant year-over-year declines in occupancy rates, except in Greater Sudbury, which has maintained stability.
Ottawa, despite a sharp 56% decline, still enjoys a relatively high occupancy rate of 69%. Hosts here should use dynamic pricing, cater to government and business travelers, and upgrade their amenities to ones that meet professionals’ needs.
Vancouver experienced the steepest drop (62%) due mainly to stringent regulations limiting short-term rentals to primary residences, encouraging hosts to pivot toward mid-term rentals and compliance-focused strategies.
New Brunswick, with a more moderate 13% decline, offers stable investment opportunities, particularly by highlighting nature tourism and family-friendly amenities.
Hamilton, down 59%, presents opportunities in mid-term rentals for healthcare professionals and academics. If possible, hosts should emphasize their Airbnb’s proximity to employment hubs and its flexible pricing.
Greater Sudbury remains steady with a 39% occupancy rate, making it attractive for investors targeting regional travelers and professionals.
Wherever you wish to invest in Canada, consider dynamic pricing, professional listings, and mid-term rental strategies, especially in areas with stringent regulations.
Airbnb Occupancy Rates by City in the United Kingdom 2025
The UK also offers numerous opportunities for profitable short-term rentals due to the large number of annual visitors. Indeed, when choosing between hotels vs Airbnb, more and more travelers go for the latter.
But what is the average Airbnb occupancy rate by city in the United Kingdom?
- London: 51% (-31% YOY)
- Bristol: 49% (-57% YOY)
- Greater Manchester: 42% (-61% YOY)
The UK Airbnb market in major cities has seen notable declines in occupancy rates this year.
In London, despite declining occupancy, strong demand for tourism and business travel persists. Hosts should leverage dynamic pricing, focus on business-friendly amenities, and highlight their proximity to landmarks and transportation hubs.
Meanwhile, Bristol’s occupancy challenges suggest oversupply and regulatory pressures. Hosts here should consider flexible pricing strategies, enhance their listings with unique local experiences, and potentially transition to mid-term rentals targeting university affiliates, healthcare professionals, and remote workers. They might also consider limiting rental days or pivoting to mid-term rentals to comply with upcoming short-term rental regulations.
Lastly, Greater Manchester faces significant occupancy challenges, indicating market saturation. Investors and hosts may benefit from niche marketing, competitive pricing, and leveraging local events or industry-related travel opportunities to their advantage. Like Bristol, pivoting partially to mid-term stays can provide consistent revenue.
Across these UK cities, the evolving regulatory landscape requires investors and hosts to proactively comply and be flexible with their strategies. Before investing here, make sure to carefully evaluate the regulatory risks, emphasize high-quality amenities, and consider a hybrid rental strategy to sustain your Airbnb’s occupancy and revenue.
Average Occupancy Rate by City in Australia 2025
Australia is also a key vacation rental market, so let’s take a look at the occupancies vacation rental hosts and managers can expect in 2025:
- Western Australia: 46% (+111% YOY)
- Melbourne: 17% (-68% YOY)
In 2025, Airbnb occupancy rates in Australia show stark contrasts between Western Australia and Melbourne.
Western Australia, with a 46% occupancy rate, benefits from surging domestic tourism, its attractive natural environments, and relatively lenient regulations. Investors and hosts here can capitalize on the growing demand by promoting local outdoor experiences, using dynamic seasonal pricing, and enhancing guest experiences through value-added services like local guides and adventure gear rentals.
Conversely, Melbourne faces significant challenges, with occupancy down sharply to just 17%. Factors include strict local short-term rental regulations, market saturation, shifts in post-pandemic travel patterns, and competition from traditional accommodations, such as hotels.
To navigate this challenging market, Melbourne Airbnb hosts should pivot toward mid-term rentals, aggressively price their properties to attract longer-term guests, and invest in amenities that attract remote workers and temporary residents, such as reliable internet.
Which Cities Have the Highest Occupancy Rates in 2025?
When analyzing Airbnb occupancy rates by city, it’s essential to consider both the markets that perform best and those that perform worst in this category. This gives an excellent idea of the range of occupancies that hosts can expect across the US market this year.
Highest Occupancy Rates in US Cities
The 11 US cities (minimum of 100 active listings) with the best occupancy in 2025 include:
- Whittier, CA: 86% (prev. 81%)
- Westminster, CA: 86% (prev. 75%)
- Visalia, CA: 86% (prev. 76%)
- Walnut Creek, CA: 85% (prev. 79%)
- Villa Park, CA: 84% (prev. 78%)
- Wilmington, CA: 84% (prev. 80%)
- Van Nuys, CA: 83% (prev. 75%)
- Valley Village, CA: 82% (prev. 73%)
- Vista, CA: 81% (prev. 74%)
- Windsor Hills, CA: 81% (prev. 79%)
- Winnetka, CA: 81% (prev. 72%)
Currently, occupancies exceed 80% in the most in-demand US markets, and all these markets have seen a significant improvement since 2024.
Lowest Occupancy Rates in US Cities
The 12 US cities (at least 100 listings) with the lowest average Airbnb vacancy rate are:
- Wainscott, NY: 11% (prev. 20%)
- East Hampton, NY: 17% (prev. 21%)
- Pacifica, CA: 21% (prev. 76%)
- Montauk, NY: 22% (prev. 29%)
- Aspen, CO: 24% (prev. 38%)
- Fenwick Island, DE: 25% (prev. 48%)
- Oxford, MS: 25% (prev. 32%)
- Hunter, NY: 27% (prev. 34%)
- Stillwater, OK: 27% (prev. 37%)
- Windham, NY: 28% (prev. 34%)
- Ludlow, VT: 28% (prev. 46%)
- Tuscaloosa, AL: 28% (prev. 40%)
The average Airbnb occupancy rates in these cities range from 11% to 28%, which is historically low. These figures highlight the growing challenges for hosts, which are tied to seasonal demand, regulatory pressure, market saturation, and event-based travel cycles.
10 Ways to Increase Your Airbnb Occupancy Rate
The good thing about the performance of your short-term rental is that it is not set in stone. If your current management strategy is not producing the expected results, there are several things you can adjust to try to increase the number of reservations.
Here are a few tips for improving the occupancy rate for Airbnb properties:
1. Optimize the Daily Price
The price you set for your short-term rental is one of the most influential factors that determine average occupancy. Your strategy needs to be based on competitor analysis and to be dynamic.
Initially, you should study the local market and price your Airbnb to be competitive with other listings, especially if you’re a beginner. Then, you have to continue updating your pricing in line with changes in market demand. You can increase your nightly rate during peak season to boost rental income. During the low season, though, you should bring your daily rates down to continue getting booked nights.
Seasonality can depend on the actual meteorological season, weekdays versus weekends, local events, and other factors.
If choosing a pricing plan that works for you looks like too much work, don’t worry. Luckily, you can use Mashvisor’s Airbnb dynamic pricing tool to help automate the process. Mashvisor suggests competitive prices that will help you not only boost occupancies but also maximize revenue and profit. This is based on a detailed analysis of trends in the local rental market, the performance of comps, and your property’s past performance.
The best part is that you can let the Mashvisor dynamic pricing tool take control of your pricing strategy and automatically import the recommended rates to your Airbnb listing.
2. Work on Positive Reviews
Airbnb reviews are instrumental in increasing your Airbnb occupancy rate. For many guests, the review section is more important than the listing title and description. Therefore, you should focus on getting positive reviews from your guests.
To achieve this, you need to first and foremost offer outstanding services. Communication is vital in this regard, so you need to answer queries promptly. In addition, you should communicate proactively by providing all necessary check-in and property information before being asked for it. Then, remain reachable during the stay.
After your stay, make the first move by providing your guests with a positive review on the platform, so Airbnb prompts them to give you a review in return.
Alternatively, you can check in with guests after their stay and ask if they wouldn’t mind leaving a review.
If you struggle to get reviews from guests, you can automate the process with Mashvisor’s unified inbox tool. Communication automation allows you to spend less time on repetitive tasks in your vacation rental business and focus on more productive aspects.
With the Mashvisor inbox feature, you can manage all communication with guests on a single platform, regardless of the number of listings or websites on which you list them. You can use templates to automate many parts of your communication by sending automated campaigns before, during, and after your guests’ stays.
This prompt and efficient communication is guaranteed to improve guest satisfaction and make them more willing to write you a positive review. Moreover, you can automate messages after check-outs to kindly ask for reviews. Sometimes all that guests need is a small reminder.
3. Highlight Your Best Amenities
The amenities that you offer at your Airbnb rental are another factor that significantly influences Airbnb occupancy rates. Guests value additional features that go beyond the basics to make their stay more enjoyable and memorable.
Ideally, the Airbnb amenities at your property should match the tastes of the target guest niche for your property type. However, some extras are generally demanded and contribute more to the guest experience than others.
Following is a list of the most demanded Airbnb amenities that are guaranteed to help you grow reservations:
- Swimming pool
- High-speed internet
- Furnished kitchen
- Free parking
- Hot tub
- Air conditioning and heating
- Washer and dryer
- Self check-in
- TV
- Fireplace
- Coffee machine
- Laptop-friendly working space
- Barbecue area
- Extra bedding and towels
- Family-friendly environment
- Pet-friendly space
- Comfortable seating options
- Dining table and chairs
- Private entrance to the home
- Breakfast included
- Outdoor sitting area
- Outdoor children’s playground
Before you start adding new amenities, it’s a smart move to calculate both the cost and the expected increase in reservations and revenue. Ensure that any of these extras will generate a positive cash flow.
Additionally, take high-quality photos of the amenities and include them in your listing description.
4. Offer Discounts
Discounted rates are a good way to stand out from other Airbnb rental properties in the area, as guests enjoy the opportunity to save money while getting the same quality.
You can offer discounts for early bookings, which is one of the most common ways to increase bookings. You may also offer discounts for multiple bookings or to those who wish to take advantage of additional Airbnb experiences that you offer.
You can use the Mashvisor Airbnb calculator to check how each change in daily rates and expected occupancy rate will affect your monthly income, cap rate, and cash-on-cash return.
5. Offer Benefits for Longer Stays
Some hosts offer added benefits to guests who stay for more extended periods, such as a slightly lower nightly rate. Others may charge a one-time cleaning service fee for stays of a month or more. It all depends on your creativity as a host.
The good news is that Mashvisor’s vacation rental channel manager can help you easily adjust your special pricing for longer stays, such as a week or a month. No matter how many listings you manage, you can quickly apply a weekly stay discount and a monthly stay discount as a percentage of the standard price, allowing them to work alongside your dynamic pricing strategy.
6. Have a Target Market in Mind
Before you start working on some of the other tips, you need to define your target guest type. Depending on your market, property type, and preferences, you may decide to cater to business travelers, remote workers, couples, or families on vacation.
Knowing your target market will help you improve your investment property and adjust your marketing strategy strategically to boost your Airbnb occupancy rate.
7. Take Advantage of Social Media
You can use your social media account to market your short-term rentals, or you can create accounts dedicated to your Airbnb rentals as part of your vacation rental marketing strategy.
Either way, you want to maintain brand consistency for your Airbnb business across all platforms.
Here are some social media tips to help you boost your reservations:
- Share helpful information on your Facebook business page for potential guests to see what you have to offer.
- Open an Instagram or TikTok account and work with influencers and bloggers to help you gain more exposure for your business.
- Post your rental’s high-quality images on Twitter and use hashtags related to travelers and short-term rentals.
When it comes to posting, the most important type of content is photos of your rental. Remember that the pictures should be professional, so you can use the same high-quality images you’ve uploaded on your Airbnb listing.
Also, stay consistent with your posting schedule. Don’t be discouraged if your posts initially get fewer likes and shares than you’d like. You have to start from somewhere and then slowly build on that. With time, more and more people will see your posts on those platforms.
8. Lower the Minimum Stay Between Bookings
Most Airbnb hosts set their minimum stays to a few days, which may discourage visitors staying for short periods and negatively affect your occupancy, rental income, and cash flow. A great way to ensure your rental doesn’t stay vacant is by opening Airbnb bookings for single nights.
This will increase your visibility on the platform and attract short-term Airbnb guests.
Keep in mind that you can set a 1-night minimum stay for one or multiple listings efficiently using Mashvisor’s multi-calendar. With our tool, you can manage the availability and the rules of all your listings from a single view.
While lowering your minimum stay to one night will definitely increase property management tasks, it will also help you get more guests. More guests mean more bookings and fewer vacancies.
9. Offer Special Deals
You may find yourself having potential guests who are unable to decide between two similar listings. Your best bet is to send them a special offer that still ensures positive cash flow. While you won’t make as much rental income as initially planned, it’s better than having vacant Airbnb properties. You can use the Airbnb platform to do that.
Another way to offer special deals is by giving previous guests discounts on their next visit. You can mention it to them when they check out or when you follow up with them after their stay. This demonstrates goodwill and also lets your guests know what to expect when they book with you again. You’ll see a boost in your average occupancy rate for Airbnb if you do this regularly.
10. Use a Property Management Software
While hiring an additional person on your team can help reduce your hosting duties, using a property management software can be a more cost-effective option.
Mashvisor’s vacation rental software can help you optimize and automate many aspects of the Airbnb property management process.
These include:
- Using the latest and most reliable Airbnb occupancy rate data and other stats for informed business decisions
- Applying a dynamic vacation rental pricing strategy to strike the right balance between reservations and nightly rates
- Making changes and edits to all your listings’ details from a single platform
- Managing availability and pricing from a single place to boost Airbnb rental income
- Automating communication with guests to reduce the cancellation rate and get more positive reviews
Conclusion
Striking the best possible Airbnb occupancy rate, without unnecessarily sacrificing pricing, is the key to a successful short-term rental business. This starts with choosing a popular market, continues with adding the right amenities, and finishes with optimizing your listing.
If you need some extra help in the management of your Airbnb rentals, check out the Mashvisor vacation rental software platform. The available professional hosting tools will help you manage multiple listings from a single location, apply automated dynamic pricing, optimize communication, and speed up listing optimizations.